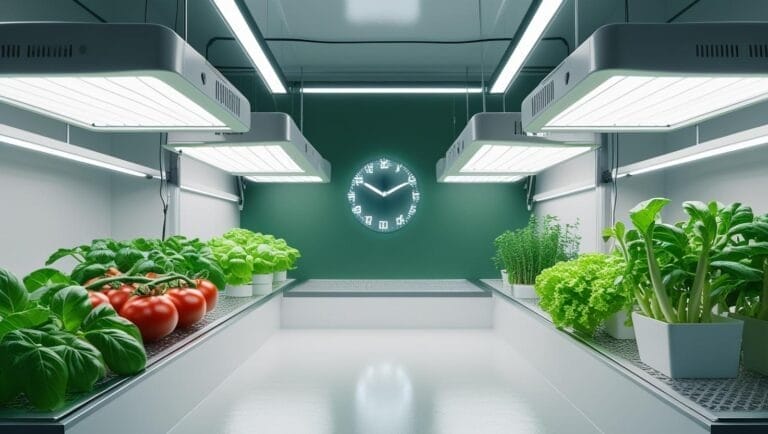
Understanding DLI - Hero Image

Understanding DLI: How Much Light Do Plants Need?

Home >
Hydroponic Systems >
Understanding DLI: How Much Light Do Plants Need?

Last Updated: July 2026  |  Reviewed for photon flux kinetics, light saturation point thresholds, and CO2 photoassimilation efficiency

Quick Answer: Daily Light Integral (DLI) measures the total number of Photosynthetically Active Radiation (PAR) photons delivered to a one-square-meter plant canopy over a 24-hour photoperiod, expressed in mol/m²/day. Leafy greens like lettuce thrive at 14–17 mol/m²/day, while high-energy fruiting crops like tomatoes and cucumbers require 25–35 mol/m²/day for peak fruit yield.

Metric Type: Cumulative Daily Photons
Leafy Green DLI: 14–17 mol/m²/day
Fruiting Crop DLI: 25–35+ mol/m²/day

What Most Guides Miss (And What You Will Learn Here)

  • Why PPFD instant spot readings can mislead growers into over-lighting or under-lighting crops across 18-hour photoperiods.
  • How extending photoperiod length at a lower PPFD intensity achieves target DLI while saving up to 30% on electrical equipment sizing.
  • The biochemical saturation point where excess photons cause non-photochemical quenching and true photo-oxidative bleaching.
  • How elevating ambient CO2 to 1,200 ppm raises the enzymatic saturation limit of Rubisco, enabling crops to absorb up to 45 mol/m²/day.
  • Why Vapor Pressure Deficit (VPD) and leaf surface temperature must be tuned in lockstep with photon irradiance.

Daily Light Integral (DLI): The total cumulative moles of photosynthetically active photons (400–700 nm) striking one square meter of canopy surface over a complete 24-hour day ($\text{mol/m}^2/\text{day}$).

Calculate DLI Indoors fixed - Understanding DLI: How Much Light Do Plants Need?
Calculate dli indoors fixed for Understanding DLI: How Much Light Do Plants Need?.

How Do You Calculate the Daily Light Integral?

Measuring instantaneous light intensity fails to capture the cumulative energy plants absorb over a photoperiod. The Daily Light Integral (DLI) quantifies the total moles of photons delivered per square meter over a 24-hour cycle. To calculate this metric, growers must first measure the Photosynthetic Photon Flux Density (PPFD) using a calibrated solid-state quantum PAR sensor. Avoid cheap lux or foot-candle meters, as they skew spectral data and yield inaccurate calculations.

Take multiple PPFD measurements across your canopy at the target plant height to establish a reliable average. Record these values in micromoles per square meter per second (µmol/m²/s) to account for spatial light distribution. This average PPFD value serves as the baseline variable for all subsequent mathematical modeling of your lighting system.

The DLI Calculation Formula and Constants

Converting instantaneous micromoles to daily cumulative moles requires matching time scales and scientific units. There are 3,600 seconds in an hour, which scales the per-second measurement to an hourly value. Dividing the total by 1,000,000 converts the value from micro-moles to whole moles of light energy. This calculation produces the standardized unit of moles per square meter per day (mol/m²/day).

To simplify this calculation in active greenhouse management, use the constant factor of 0.0036. The simplified formula is: DLI = PPFD × photoperiod (hours) × 0.0036. For example, maintaining an average PPFD of 400 µmol/m²/s for a 16-hour photoperiod yields a calculation of 400 × 16 × 0.0036. This mathematical sequence delivers exactly 23.04 mol/m²/day to the crop canopy.

Target DLI Thresholds for Commercial Hydroponic Crops

Different crop species demand specific DLI targets to prevent physiological disorders and optimize biomass accumulation. Low-light crops like butterhead lettuce thrive in a range of 14 to 17 mol/m²/day. Exceeding 17 mol/m²/day in leafy greens often triggers tipburn, a calcium deficiency caused by rapid growth outpacing transpiration. Conversely, dropping below 12 mol/m²/day causes weak, etiolated petioles and thin leaf structures.

Fruiting crops like tomatoes, cucumbers, and peppers require significantly higher energy levels to drive reproductive growth. Maintain a target DLI of 22 to 30 mol/m²/day for these heavy feeders during their generative stages. For high-energy crops like medical cannabis, DLI targets can scale up to 35 to 45 mol/m²/day. When target DLIs exceed 30 mol/m²/day, you must supplement carbon dioxide (CO2) up to 1,200 to 1,500 ppm to prevent light saturation and photobleaching.

Actionable Tuning and Photoperiod Adjustments

When your calculated DLI falls short of target thresholds, you can adjust either light intensity or photoperiod length. If canopy height limits your physical space, increase the photoperiod to accumulate more moles without raising heat stress. Conversely, you can lower the fixtures or increase the driver current to boost PPFD, thereby reducing the required photoperiod hours. This operational flexibility allows growers to optimize energy efficiency (PPF/W) and manage utility costs during peak billing hours.

Always calibrate your calculations when utilizing greenhouse supplemental lighting. Account for the greenhouse glazing transmission loss, which typically reduces natural light by 30% to 50% before it hits the crop. Utilize automated environmental controllers integrated with quantum sensors to dynamically adjust supplemental LED fixtures. This integration ensures your target DLI is met precisely, regardless of shifting seasonal weather patterns.

1. PPFD is Only Half of the Equation

Calculating Daily Light Integral (DLI)

To optimize crop yield, hydroponic growers must shift focus from instantaneous Photosynthetic Photon Flux Density (PPFD) to Daily Light Integral (DLI). PPFD measures the micromoles of photons hitting a one-square-meter area per second (μmol/m²/s), whereas DLI quantifies the cumulative moles of light delivered over a 24-hour cycle (mol/m²/day). Calculate DLI using the formula: DLI = PPFD × photoperiod (hours) × 0.0036.

For high-productivity leafy greens like butterhead lettuce, target a DLI of 14 to 17 mol/m²/day to prevent tipburn while maximizing biomass. Fruiting crops such as tomatoes and cannabis require far higher target DLIs of 22 to 35 mol/m²/day. Attempting to achieve these targets with short, high-intensity light bursts increases cooling requirements and risks severe phototoxicity.

Biophysical Kinetics of Photoinhibition

Inside the chloroplast thylakoid membranes, light-harvesting complex II (LHCII) funnels absorbed photons to Photosystem II (PSII). This absorption drives electrons down the photosynthetic Z-scheme electron transport chain to generate the ATP and NADPH needed for the Calvin-Benson cycle. When PPFD exceeds the processing capacity of the plastoquinone pool (QA and QB acceptors), the electron transport chain becomes completely reduced.

This light-saturated state leads to the generation of reactive oxygen species (ROS), specifically singlet oxygen (¹O₂) and superoxide radicals, which degrade the D1 core protein of PSII. To mitigate this damage, plants activate Non-Photochemical Quenching (NPQ), dissipating excess energy as heat. This protective mechanism reduces overall quantum yield, meaning valuable electrical energy is wasted as heat rather than driving carbon assimilation.

Optimizing Light Delivery with Environmental Parameters

Balancing high DLI with ambient carbon dioxide levels prevents biochemical bottlenecks at the Rubisco enzyme level. If PPFD exceeds 800 μmol/m²/s, elevate carbon dioxide levels to 1200 to 1500 ppm to keep pace with light-harvesting reactions. Without elevated carbon dioxide, the Calvin-Benson cycle becomes saturated, rendering higher light intensities useless and potentially damaging to the canopy.

Simultaneously maintain Vapor Pressure Deficit (VPD) targets between 0.8 and 1.1 kPa for vegetative growth, and 1.2 to 1.5 kPa during generative stages to support transpirational pull. Ensure your nutrient solution’s Electrical Conductivity (EC) is adjusted to handle the increased metabolic rate, scaling between 1.8 and 2.4 dS/m to prevent nutrient deficiencies. Monitor leaf-to-air temperature differentials using infrared thermometry, targeting a leaf temperature 2°C to 3°C below ambient air to confirm active transpiration and prevent thermal stress.

Indoor Plant Lighting Guide 202607101623 - Understanding DLI: How Much Light Do Plants Need?
Indoor plant lighting guide 202607101623 for Understanding DLI: How Much Light Do Plants Need?.

🌱 Join the Inner Circle

Get our latest hydroponic blueprints, nutrient calculators, and exclusive DIY builds sent straight to your inbox.


No spam. 1-Click Unsubscribe & Delete My Data anytime.

2. Plants Have a Maximum Daily Light Limit

The premise that more light always translates to greater yield in hydroponic systems is fundamentally flawed. Each botanical species exhibits a physiological light saturation point, primarily governed by the kinetic properties of the enzyme Ribulose-1,5-bisphosphate carboxylase-oxygenase (Rubisco) . This bifunctional enzyme, central to the Calvin cycle, catalyzes both the carboxylation of RuBP with CO₂ and the oxygenation of RuBP with O₂. Its relatively slow turnover rate and competitive affinity for oxygen create a significant bottleneck in carbon fixation efficiency, particularly under high photon flux where oxygenase activity can increase.

When incident photosynthetic photon flux density

When incident photosynthetic photon flux density (PPFD) exceeds the cell’s capacity for electron transport and downstream biochemical processing, the photosynthetic machinery, specifically Photosystem II (PSII), can suffer damage, leading to photo-inhibition .

This state is characterized by a

This state is characterized by a reduction in quantum yield and often involves the degradation of the D1 protein within the PSII reaction center, a dynamic process of damage and repair that becomes overwhelmed under persistent supraoptimal light.

At low to moderate PPFD levels, the rate of CO₂ assimilation typically shows a near-linear response to increasing photon flux. However, as light intensity continues to rise, the photosynthetic rate curve gradually flattens, eventually reaching an asymptote. This inflection point signifies the light saturation point ($LSP$), beyond which additional photons contribute minimally, if at all, to carbon fixation. The $LSP$ is highly variable, influenced by genetic factors, ambient CO₂ concentration, leaf temperature, and nutrient availability.

The Daily Light Integral (DLI)

The Daily Light Integral (DLI) , representing the total moles of photons delivered per square meter per day (mol/m²/day), serves as a more accurate metric for cumulative light exposure than instantaneous PPFD alone.

For many hydroponic leafy greens like

For many hydroponic leafy greens like butterhead lettuce, the optimal DLI typically ranges around 17 mol/m²/day under standard atmospheric CO₂ levels (approximately 400-450 ppm). Exceeding this DLI without compensatory environmental adjustments, such as CO₂ enrichment or optimized temperature and humidity, can trigger undesirable physiological responses rather than enhancing growth.

Exposure to light beyond the $LSP$ leads to an over-reduction of the electron transport chain, resulting in the generation of highly destructive Reactive Oxygen Species (ROS) such as superoxide radicals (O₂•⁻), hydrogen peroxide (H₂O₂), and hydroxyl radicals (•OH). These unstable molecules induce severe oxidative stress, causing lipid peroxidation in chloroplast membranes, irreversible protein degradation, and DNA damage, ultimately compromising cellular integrity and photosynthetic function. To counteract this, plants activate sophisticated photoprotective mechanisms. A primary defense is the xanthophyll cycle , which involves the enzymatic de-epoxidation of violaxanthin to antheraxanthin and then zeaxanthin.

This cycle facilitates non-photochemical quenching (NPQ)

This cycle facilitates non-photochemical quenching (NPQ), safely dissipating excess excitation energy absorbed by antenna pigments as harmless heat, rather than allowing it to form damaging ROS.

However, sustained activation of NPQ consumes

However, sustained activation of NPQ consumes metabolic energy and can reduce overall photosynthetic efficiency. Pushing hydroponic leafy greens beyond 18 mol/m²/day, particularly without simultaneous CO₂ supplementation to mitigate Rubisco’s limitations, frequently manifests as localized calcium deficiency tip burn due to impaired membrane integrity and reduced transpiration-driven calcium transport, alongside the accumulation of bitter secondary metabolites that diminish product quality and market value.

3. The Rain Bucket Analogy Explains It Perfectly

To engineer a high-performance cultivation facility, you must treat light as a quantifiable, physical input. In this system, Photosynthetic Photon Flux Density (PPFD) represents the instantaneous rate of photon delivery, measured in micromoles per square meter per second (µmol/m²/s). Think of PPFD as the real-time intensity of a rainstorm hitting your canopy. Meanwhile, the Daily Light Integral (DLI) acts as the cumulative volume of rain collected, quantified in moles per square meter per day (mol/m²/day) over a given photoperiod.

Leafy greens like butterhead lettuce require a modest target DLI of 14 to 17 mol/m²/day to prevent tipburn and optimize growth cycles. Conversely, high-energy crops like tomatoes, cucumbers, or medical cannabis demand a robust DLI of 30 to 45 mol/m²/day. Manipulating the balance between instantaneous PPFD and total photoperiod duration allows you to hit these targets without overstressing the plant’s metabolic capacity.

Calculating the Photoperiod and DLI Formula

To calculate DLI precisely, use the standard mathematical formula: DLI = PPFD × photoperiod (hours) × 0.0036. For instance, if your LED fixtures deliver a constant PPFD of 600 µmol/m²/s over an 18-hour photoperiod, the resulting DLI is 38.88 mol/m²/day. This calculation allows you to adjust your lighting footprint to match the exact genetic requirements of your crop.

If you observe signs of light stress under high PPFD, you can lower the instantaneous intensity to 450 µmol/m²/s and extend the photoperiod to 24 hours to achieve the exact same DLI of 38.88 mol/m²/day. This strategy is highly effective for photoperiod-insensitive crops and autoflowering cultivars. It reduces the peak thermal load on the leaves while maintaining a steady rate of carbohydrate accumulation.

The Physiology of Photo-Inhibition and Light Saturation

When the instantaneous PPFD exceeds the light saturation point (LSP), the leaf’s photosynthetic machinery becomes overwhelmed. The excess photons cannot be processed by Photosystem II (PSII), leading to a bottleneck in electron transport. This state triggers photo-inhibition, where surplus energy damages the core D1 reaction center protein.

To protect itself, the plant initiates Non-Photochemical Quenching (NPQ), dissipating the excess energy as harmless heat. However, if the PPFD remains excessively high, the energy generates reactive oxygen species (ROS). These highly destructive molecules degrade chlorophyll pigments, causing visible chlorosis, bleaching, and irreversible necrosis of the upper canopy tissues.

Aligning EC and VPD with Light Intensity

Hydroponic success requires aligning your light delivery with nutrient delivery and environmental controls. Under elevated PPFD, transpiration rates accelerate, forcing the plant to pull water rapidly from the root zone. You must adjust your reservoir electrical conductivity (EC) downward to prevent nutrient toxicity as water uptake outpaces ion uptake.

For example, if you run a PPFD of 900 µmol/m²/s, maintain a target EC of 1.2 to 1.6 mS/cm depending on the crop. Concurrently, stabilize your Vapor Pressure Deficit (VPD) between 1.0 and 1.4 kPa to keep stomata open. This precise environmental pairing prevents stomatal closure, ensuring a steady flow of carbon dioxide to match the high photon influx.

Calculate DLI Indoors fixed - Understanding DLI: How Much Light Do Plants Need?
Calculate dli indoors fixed for Understanding DLI: How Much Light Do Plants Need?.

4. Different Hydroponic Crops Have Vastly Different Needs

Hydroponic cultivation requires precise alignment of light delivery, nutrient concentrations, and environmental parameters to match the specific physiological blueprints of individual crop species. Broad-spectrum generalizations fail because a plant’s photosynthetic machinery is optimized for specific light intensities, measured as Photosynthetic Photon Flux Density (PPFD), and total cumulative light exposure, measured as Daily Light Integral (DLI). Cultivators must engineer targeted microclimates that synchronize light delivery with electrical conductivity (EC), pH, and vapor pressure deficit (VPD) to maximize biomass accumulation and secondary metabolite production.

Leafy Greens and Herbs: Low-Light, High-Nitrogen Targets

Leafy greens such as butterhead lettuce and culinary herbs like sweet basil require moderate light intensities to prevent physiological disorders. Keep PPFD ranges strictly between 150 and 250 µmol/m²/s over a 16 to 18-hour photoperiod, yielding a target DLI of 14 to 17 mol/m²/day. Exceeding these thresholds accelerates transpiration beyond the plant’s vascular capacity, triggering localized calcium deficiencies known as tip burn.

Maintain nutrient solutions at an EC of 1.2 to 1.8 dS/m and a pH range of 5.5 to 6.0. Keep water temperatures at 18°C to 20°C (64°F to 68°F) to maximize dissolved oxygen levels above 8 mg/L, which prevents Pythium outbreaks. Air circulation must support a target VPD of 0.8 to 1.1 kPa to promote steady transpirational pull, enabling calcium ions to reach growing leaf margins.

Fruiting Crops: High-Energy, Multi-Phase Dynamics

Heavy-feeding fruiting crops like vine-ripened tomatoes and bell peppers demand high-energy inputs to transition from vegetative growth to heavy fruit sets. During the vegetative stage, support structure development with a PPFD of 350 to 500 µmol/m²/s and an EC of 2.0 to 2.5 dS/m. Once reproductive phases begin, escalate light intensity to 600 to 1000 µmol/m²/s, targeting a robust DLI of 25 to 35 mol/m²/day to fuel carbohydrate synthesis.

As crops shift to the generative phase, alter the nutritional profile by shifting the nitrogen-to-potassium (N:K) ratio from 1:1 to 1:2 or higher. Elevate root-zone EC to 2.5 to 3.5 dS/m to increase osmotic pressure, which concentrates sugars and improves fruit brix levels. Adjust the target pH to 5.8 to 6.2 to optimize phosphorus and potassium uptake, which are necessary for heavy blossom development and fruit cell division.

Precision Monitoring and Sensor Integration

To implement these environmental parameters, deploy solid-state quantum PAR sensors at the canopy level to map light distribution and adjust LED dimming drivers. Pair these light readings with inline toroidal EC sensors and double-junction pH electrodes for real-time root-zone monitoring. This integration allows automated dosing systems to adjust ionic concentration in response to increased transpiration during high-DLI periods. Maintaining this precise equilibrium between photon absorption and nutrient uptake prevents nutrient lockout, salt buildup, and osmotic shock.

Hydroponic Crop DLI Target Matrix & Ideal Photoperiod Settings
Crop / Growth Stage Minimum DLI (mol/m²/d) Optimal DLI Target Recommended PPFD Photoperiod (Hours)
Lettuce & Leafy Greens 12 14 – 17 230 – 260 µmol/m²/s 18 hrs
Culinary Herbs (Basil, Mint) 12 15 – 20 280 – 320 µmol/m²/s 16 – 18 hrs
Strawberries (Vegetative/Fruit) 15 20 – 25 380 – 430 µmol/m²/s 16 hrs
Tomatoes & Peppers (Veg) 18 22 – 28 400 – 480 µmol/m²/s 16 hrs
Tomatoes & Peppers (Flowering) 25 30 – 35 650 – 780 µmol/m²/s 12 – 14 hrs
Cucumbers & Heavy Vine Crops 25 30 – 40 700 – 850 µmol/m²/s 14 – 16 hrs

5. Seedlings Are Highly Sensitive to Photon Bombardment

Emergent seedlings and recently rooted clones possess underdeveloped photosynthetic machinery, making them exceptionally susceptible to excessive irradiance. Their proplastids are still maturing into fully functional chloroplasts, meaning the thylakoid membranes and associated photosystem complexes (Photosystem I and II) are not yet robustly established. This structural immaturity, coupled with a reduced capacity for producing protective pigments like carotenoids and anthocyanins, renders their delicate leaf tissue highly vulnerable. Exposing these young propagules to a high adult-stage Daily Light Integral (DLI), typically exceeding 15 mol/m²/day, triggers severe photo-oxidative stress.

This process involves the over-excitation of

This process involves the over-excitation of chlorophyll molecules, leading to the generation of Reactive Oxygen Species (ROS) such as singlet oxygen and superoxide radicals.

These ROS inflict cellular damage, degrading

These ROS inflict cellular damage, degrading chlorophyll, lipids, and proteins, which manifests as photo-bleaching or chlorosis and significantly impedes metabolic functions.

Beyond foliar damage, this oxidative stress diverts significant energy away from growth and towards cellular repair, directly inhibiting root development and leading to what is termed ‘root arrest.’ The sensitive meristematic tissues in the root tip are particularly susceptible to this energy drain and direct ROS damage, halting cell division and elongation. For optimal development, maintain propagation nurseries at a gentle 6 to 8 mol/m²/day. This DLI range corresponds to an approximate Photosynthetic Photon Flux Density (PPFD) of 100–120 µmol/m²/s when delivered over an 18-hour photoperiod.

Achieving this target PPFD often requires

Achieving this target PPFD often requires careful light fixture placement; for instance, many T5 fluorescent fixtures may need to be positioned 12-18 inches above the canopy, while lower-output LED panels might be 18-24 inches away. Always confirm actual PPFD with a calibrated quantum sensor at canopy height. Consistent adherence to this intensity prevents phototoxicity, encourages robust hypocotyl and cotyledon development, and most importantly, supports the vigorous initiation and expansion of the primary root system.

Once the first set of true leaves has fully expanded and the seedling exhibits healthy root development extending to the edges of the propagation cube, the plant signals its readiness for increased light exposure. This physiological milestone indicates a more developed chloroplast network, increased leaf surface area for light capture, and a greater capacity for enzymatic photoprotection. Begin gradually increasing the light intensity by approximately 2 mol/m²/day every 48 hours . This incremental approach allows the plant to acclimate without shock.

Monitor for any signs of stress

Monitor for any signs of stress, such as leaf curling, bleaching, or stunted internodal elongation, which would indicate that the ramp-up is too aggressive.

The goal is to incrementally stimulate

The goal is to incrementally stimulate photosynthetic activity, preparing the young plant for the higher light levels of the vegetative growth stage without inducing stress or causing permanent damage to its delicate early structures. Fine-tuning involves observing both DLI measurements and the plant’s phenotypic response.

Calculate DLI Indoors infographic 202607101625 - Understanding DLI: How Much Light Do Plants Need?
Calculate dli indoors infographic 202607101625 for Understanding DLI: How Much Light Do Plants Need?.

6. Extending the Photoperiod Saves Electricity

Optimizing your Daily Light Integral (DLI) delivery is a cornerstone of efficient hydroponic cultivation. While DLI represents the total amount of photosynthetically active radiation a plant receives over 24 hours (moles of photons per square meter per day), the pathway to achieving that DLI profoundly impacts your operational expenditure and capital investment. By strategically extending the photoperiod – the duration of light exposure – and simultaneously reducing the instantaneous light intensity (Photosynthetic Photon Flux Density, PPFD), growers can realize substantial efficiencies.

Consider the inherent relationship: DLI = PPFD × photoperiod duration. To maintain a constant DLI, a decrease in PPFD necessitates an increase in the photoperiod. For instance, achieving a target DLI of 20 mol/m²/day can be accomplished with 500 µmol/m²/s over 11.1 hours, or with 350 µmol/m²/s over approximately 15.9 hours. This second scenario, running fixtures at a lower output, translates directly into reduced peak electrical demand per fixture.

The most immediate financial benefit

The most immediate financial benefit arises in LED driver sizing and capital cost . LED drivers convert alternating current (AC) to direct current (DC) and regulate the power supplied to the LED diodes. Their cost scales significantly with their maximum power output capacity. By operating fixtures at a lower maximum wattage, you can specify smaller, less powerful LED drivers, which are inherently less expensive. Across an entire grow facility, this translates into substantial upfront savings on lighting infrastructure.

Beyond this, operating drivers at lower

Beyond this, operating drivers at lower loads can sometimes place them within a more efficient operating range, marginally improving overall system efficacy and longevity.

Another significant advantage lies in mitigating peak HVAC thermal loads . Even highly efficient LED grow lights convert a portion of their electrical input into heat, which must be removed from the grow environment to maintain optimal plant temperatures. When fixtures run at lower instantaneous wattage, they generate less heat per unit of time. This reduces the peak cooling demand on your HVAC system. A lower peak demand allows for the specification of smaller, less expensive HVAC equipment, again cutting capital costs.

Reduced peak thermal loads lead to

Reduced peak thermal loads lead to a more stable environment, minimizing temperature swings that can negatively impact plant health and CO2 uptake, while also decreasing the operational electricity consumption of the HVAC system itself.

This strategy is particularly effective for day-neutral plants and those requiring long photoperiods, such as leafy greens, herbs, and many fruiting vegetables in their vegetative stages. For these crops, extending the light cycle to 16-20 hours while reducing intensity can be a powerful tool for energy management. Always consider the specific photoperiodic requirements of your target crop, ensuring a sufficient dark period for respiration and other physiological processes where applicable. Implementing this optimization requires precise control over your lighting system, allowing for flexible intensity adjustment to perfectly match your extended photoperiod strategy.

Photoperiod vs PPFD Intensity Matrix to Achieve 17.0 mol/m²/day DLI
Photoperiod Duration Required PPFD (µmol/m²/s) LED Thermal Stress Level Electrical & Canopy Impact
10 Hours 472 µmol/m²/s High Driver Stress Requires high-wattage fixtures; elevated leaf tip burn risk
12 Hours 394 µmol/m²/s Moderate-High Standard for flowering short-day photoperiod crops
14 Hours 337 µmol/m²/s Moderate Balanced vegetative and fruiting efficiency
16 Hours 295 µmol/m²/s Low-Moderate Excellent photon conversion efficiency; low heat load
18 Hours 262 µmol/m²/s Low Driver Stress Gold Standard for Hydroponic Leafy Greens
20 Hours 236 µmol/m²/s Minimal Driver Stress Maximum electrical efficiency for commercial farms

7. True Light Burn Looks Different From Heat Stress

Photo-Oxidative Chlorosis vs. Thermal Leaf Necrosis

Distinguishing between photo-oxidative light burn and infrared heat stress is a requirement for maintaining an optimized hydroponic canopy. Photo-oxidation occurs when Photosynthetically Active Radiation (PAR) levels exceed the plant’s light saturation point, typically occurring above 1000 µmol/m²/s in non-CO2 supplemented environments. This excessive photon bombardment saturates the electron transport chain (ETC), causing a complete failure in non-photochemical quenching (NPQ) pathways.

Consequently, the plant produces damaging Reactive Oxygen Species (ROS) such as singlet oxygen and hydrogen peroxide, which rapidly degrade chlorophyll a and b. These molecules also denature the carbon-fixing enzyme RuBisCO, halting sugar production. Visually, this presents as localized bleaching or chlorosis on the uppermost leaves and apical meristems directly under the diodes. The affected tissue turns a stark, paper-white color but remains pliable and flexible rather than dry or brittle.

Infrared Radiation and Transpirational Heat Stress

In contrast, thermal stress is driven by high ambient air temperatures or excessive infrared (IR) radiation emitted from inefficient lighting fixtures. When the leaf surface temperature (LST) exceeds 30°C (86°F), enzymatic pathways begin to denature, and cellular respiration outpaces photosynthesis. To prevent rapid desiccation, the plant closes its stomata, which limits transpirational cooling and halts the uptake of carbon dioxide.

This physiological defense mechanism triggers upward leaf margin curling, commonly referred to as canoeing or tacoing, as the leaf attempts to create a microclimate to shield its stomata. Unlike light-bleached leaves, heat-stressed leaves exhibit marginal necrosis, where the outer edges turn brown, dry, and distinctly crispy. This structural damage is widespread across the canopy rather than being restricted strictly to the apex closest to the light source.

Quantitative Diagnostic Protocols

To accurately diagnose and correct these conditions, hydroponic growers must utilize precise sensor data rather than visual estimation. Use a calibrated solid-state quantum PAR meter to measure the Daily Light Integral (DLI) at the canopy level. If your calculated DLI exceeds 45 mol/m²/day for C3 photoperiod crops without supplemental carbon dioxide, you must immediately reduce your PPFD by dimming the driver or increasing the light-to-canopy distance.

Simultaneously, monitor LST using an infrared thermometer to target a range of 22°C to 26°C (72°F to 79°F). If LST is elevated, cross-reference this with your room’s Vapor Pressure Deficit (VPD), keeping vegetative targets at 0.8 to 1.1 kPa and flowering targets at 1.2 to 1.5 kPa. Under high thermal loads, reduce the nutrient solution Electrical Conductivity (EC) by 0.2 to 0.4 mS/cm to prevent osmotic stress and localized salt toxicities as water transpiration rates fluctuate.

8. Carbon Dioxide Unlocks Higher Potential

Overcoming the Rubisco Efficiency Bottleneck

In standard indoor cultivation environments, the C3 photosynthetic pathway is severely limited by the enzyme ribulose-1,5-bisphosphate carboxylase-oxygenase (Rubisco) . Because Rubisco evolved during a prehistoric era of high carbon dioxide and low oxygen, it possesses a high affinity for both gases. At ambient atmospheric levels of roughly 420 ppm CO2 , Rubisco mistakenly binds with oxygen instead of carbon dioxide in up to 25% of reactions.

This process, known as photorespiration or

This process, known as photorespiration or the C2 oxidative photosynthetic carbon cycle , actively consumes metabolic energy in the form of ATP and NADPH to recover lost carbon, reducing net photosynthetic output by up to one-quarter.

By artificially elevating the cultivation environment to 1,200 ppm to 1,500 ppm CO2, you alter the competitive binding kinetics at the Rubisco active site. This oversaturation creates a mass-action effect that suppresses photorespiration by over 80%. Consequently, the enzyme operates much closer to its theoretical maximum carboxylation velocity (Vmax). This shift allows plants to convert light energy into chemical energy far more efficiently, clearing the metabolic pathway for rapid vegetative and generative development.

Elevating Light Saturation and Nutrient Thresholds

Traditional C3 crops hit a physiological light saturation point under ambient atmospheric conditions. For example, leafy greens typically saturate at a Daily Light Integral (DLI) of 14 to 17 mol/m²/day. When you raise CO2 levels to 1,200 ppm, these same crops can easily process a DLI of 22 to 25 mol/m²/day. High-demand fruiting crops, such as indeterminate tomatoes or heavy-yielding annuals, can scale up to a DLI of 40 to 50 mol/m²/day without showing signs of photo-oxidative stress.

To support this accelerated metabolic rate, you must adjust other environmental and nutritional parameters. Increase your day-time temperatures by 2°C to 4°C (targeting 28°C to 30°C or 82°F to 86°F) to accelerate enzymatic reactions. Since transpiration rates change under high CO2, increase your reservoir’s Electrical Conductivity (EC) by 10% to 20% to prevent localized nutrient deficiencies. Maintain your hydroponic nutrient solution pH strictly between 5.5 and 6.2 to guarantee optimal uptake of calcium and magnesium, which are needed for increased cell wall synthesis.

Precision Injection and Distribution Architecture

Effective carbon dioxide enrichment requires a closed-loop system managed by a Non-Dispersive Infrared (NDIR) sensor. Place this sensor at canopy height, away from direct humidification or injection points, to prevent false readings. Deliver the gas using compressed liquid CO2 cylinders regulated by a 120-volt solenoid valve connected to a digital controller. For large-scale facilities, clean-burning natural gas or propane CO2 generators are viable, though they introduce heat and water vapor that must be managed by your HVAC system.

Because carbon dioxide has a specific gravity of 1.52, it is heavier than ambient air and naturally sinks to the floor. To combat stratification, distribute the gas through perforated poly tubing suspended directly above the crop canopy. Use high-efficiency, multi-directional oscillating fans to maintain a constant air velocity of 0.3 to 0.5 meters per second across the canopy boundary layer. Finally, program your controller to disable enrichment during the dark cycle when photosynthesis ceases, preventing resource waste and localized phytotoxicity.

9. Temperature and VPD Are Inseparable from Lighting

Leaf Surface Temperature and Photosynthetic Kinetics

High photon bombardment from high-intensity LED or HID systems accelerates transpiration across the leaf epidermis. As photons strike the canopy, unabsorbed near-infrared radiation directly raises the Leaf Surface Temperature (LST) above ambient air temperature by +2°F to +5°F (1.1°C to 2.8°C). You must actively monitor this leaf-to-air temperature differential using an infrared thermometer (IR gun) to prevent metabolic deceleration.

This thermal load directly dictates the catalytic efficiency of the carbon-fixing enzyme ribulose-1,5-bisphosphate carboxylase-oxygenase (RuBisCO). When LST exceeds 86°F (30°C), RuBisCO’s affinity for carbon dioxide decreases, favoring oxygenation over carboxylation. This metabolic shift triggers photorespiration, wasting up to 25% of the plant’s accumulated photosynthetic energy and degrading net carbon gain.

To optimize enzymatic kinetics under

To optimize enzymatic kinetics under PPFD levels exceeding 800 μmol/m²/s, maintain ambient air temperatures at 74°F to 78°F (23.3°C to 25.5°C) when using LEDs. This cooling offset ensures the actual LST remains within the prime 77°F to 82°F (25°C to 27.8°C) metabolic window. Keeping LST in this range maximizes carboxylation rates and prevents heat-induced enzyme denaturation.

Stomatal Dynamics and Photo-Oxidative Stress

If your atmospheric Vapor Pressure Deficit (VPD) rises above 1.5 kPa under high Daily Light Integral (DLI), stomatal guard cells lose turgor and close to prevent cavitation. When stomatal conductance drops below 100 mmol H2O/m²/s, internal leaf CO2 concentrations plummet. This starvation halts the Calvin-Benson cycle, leaving the light-harvesting complexes with no chemical sink for their absorbed energy.

This energetic bottleneck overloads Photosystem II (PSII), leading to chronic photoinhibition. The excess excitation energy reacts with triplet oxygen, generating highly destructive Reactive Oxygen Species (ROS) like singlet oxygen and hydrogen peroxide. These ROS molecules destroy thylakoid membranes, resulting in photo-oxidative chlorosis and bleaching, even at moderate light levels.

To prevent light-burn chlorosis without

To prevent light-burn chlorosis without reducing PPFD, you must immediately lower VPD to restore stomatal opening. Supplementing with potassium (K) at target levels of 200 to 250 ppm helps regulate guard cell turgor pressure. This nutritional adjustment maintains stomatal opening under high thermal loads, allowing transpirational cooling to continue.

Precision VPD and Root Zone Management

For the vegetative phase, target an atmospheric VPD of 0.8 to 1.1 kPa to encourage cell division and leaf expansion. During generative and peak flowering phases, transition to a VPD of 1.2 to 1.5 kPa to drive the transpirational pull needed for calcium delivery to developing buds. Pair these targets with a root zone nutrient solution temperature strictly maintained between 65°F and 68°F (18°C to 20°C).

This specific thermal window keeps water viscosity low, optimizing root aquaporin channel activity for rapid water uptake. Additionally, these temperatures preserve high Dissolved Oxygen (DO) concentrations of 8.0 to 10.0 mg/L. This oxygen level is required to power the active transport of ions like nitrate, potassium, and phosphorus against their concentration gradients.

Exceeding 72°F (22.2°C) in the

Exceeding 72°F (22.2°C) in the reservoir drops DO levels below 6.0 mg/L, triggering root hypoxia and inviting opportunistic pathogens like Pythium ultimum. Monitor root-zone electrical conductivity (EC) closely; high transpiration rates under elevated VPD require you to lower feed EC by 0.2 to 0.4 mS/cm. This reduction prevents osmotic lockout and toxic salt accumulations in the growing medium.

Indoor Plant Lighting Guide 202607101623 - Understanding DLI: How Much Light Do Plants Need?
Indoor plant lighting guide 202607101623 for Understanding DLI: How Much Light Do Plants Need?.

Save this DLI Lighting Guide!

Pin this Hydroponic Daily Light Integral & PPFD Target Chart to your board.

Save to Pinterest

Pin for Understanding DLI: How Much Light Do Plants Need? - Grow lights illuminating indoor  202607101625

Frequently Asked Questions

What is the ideal DLI for hydroponic lettuce?

Hydroponic lettuce and leafy greens achieve optimal head weight and crisp texture at a DLI of 14 to 17 mol/m²/day. Exceeding 18 mol/m²/day without CO2 causes tip burn.

Can I run my LED grow lights for 24 hours straight?

While leafy greens can tolerate 24-hour light, providing a 4- to 6-hour dark period improves starch translocation and prevents calcium deficiency tip burn.

How do I convert PPFD to DLI?

Multiply PPFD (µmol/m²/s) by your daily photoperiod hours and multiply by 0.0036. For example: 250 µmol/m²/s × 18 hours × 0.0036 = 16.2 mol/m²/day.

🌿 Complete Environmental Control & Hydroponic Lighting Series

Optimize your grow room lighting and atmosphere with our engineering guides:


Similar Posts

  • How to Prepare Coco Coir for Hydroponics: The Ultimate Guide

    Home > Hydroponic Systems > How to Prepare Coco Coir for Hydroponics: The Ultimate Guide Last Updated: July 11, 2026 | Fact Checked By: Current Gardening Editorial Team Quick Answer: How to Prepare Coco Coir You cannot use raw coco coir straight out of the brick. You must complete three mandatory steps: 1. Hydration (expanding the compressed brick in warm water), 2. Rinsing (flushing out the toxic oceanic sea salts with clean water until run-off EC is below 0.5), and 3. Buffering (soaking the coir in a double-strength Calcium-Magnesium solution for 8 hours to satisfy its cation exchange capacity). If you skip the buffering step, the coir will steal calcium…

  • 10 Steps for Managing pH and EC in Hydroponics

    Home > Hydroponics > VPD Chart for Hydroponics: Stage-by-Stage Guide Last Updated: July 2026  |  Written by Wara Danish  |  Reviewed for accuracy Quick Answer: Vapor Pressure Deficit (VPD) measures the drying power of your grow room air. The ideal target is 0.8 to 1.1 kPa during vegetative growth, and 1.2 to 1.5 kPa during flowering, which maximizes transpiration and nutrient uptake. For precision control, use our Free VPD Calculator. Difficulty: Intermediate Time Needed: 15 minutes Estimated Cost: $0 What Most Guides Miss (And What You Will Learn Here) Why you must measure leaf surface temperature instead of relying solely on room temperature. How ignoring nighttime VPD spikes can cause…

  • Hydroponic Root Rot Prevention: The Complete System Hygiene Guide

    Home > Hydroponic Maintenance > Hydroponic Root Rot Prevention: The Complete System Hygiene Guide Last Updated: July 11, 2026 | Fact Checked By: Current Gardening Editorial Team Quick Answer: How to Prevent Root Rot Root rot (Pythium) is caused by a lack of dissolved oxygen in the water. The warmer the water, the less oxygen it can hold. To permanently prevent root rot, you must keep your reservoir water temperature strictly below 70°F (21°C) using a mechanical water chiller, block 100% of light leaks from entering the reservoir, and run heavy aeration (large air stones). As an added insurance policy, inject the system with a beneficial bacteria supplement like Hydroguard…

  • How to Clean and Reuse Clay Pebbles (LECA/Hydroton): Complete Guide

    Home > Hydroponic Systems > How to Clean and Reuse Clay Pebbles (LECA/Hydroton): Complete Guide Last Updated: July 11, 2026 | Fact Checked By: Current Gardening Editorial Team Quick Answer: How to Clean Clay Pebbles Yes, clay pebbles can be reused indefinitely! To clean them, first manually remove all dead root matter. Then, sterilize the pebbles to kill pathogens (like Pythium) by either boiling them in water for 15 minutes or soaking them in a strong 3% hydrogen peroxide solution for 24 hours. Finally, rinse them thoroughly with plain tap water to wash away any dissolved mineral salts, and let them dry completely before storage. Reusability Infinite (10+ Years) Best…

  • Ebb and Flow Hydroponics: The Complete Guide

    Home > Hydroponics > flood tray hydroponics: The Complete Guide Quick Answer: Known for extreme reliability, hydroponic flood table (also called Flood and Drain) works by periodically pumping nutrient-rich water from a lower reservoir into an upper tray, soaking the roots. The pump then turns off, allowing gravity to drain the water away, which physically pulls massive amounts of fresh oxygen down into the root zone. What Most Guides Miss (And What You Will Learn Here) The exact science of how the draining action acts as an oxygen piston for the roots. The specific components needed to build a reliable ebb and flow setup. The exact timing intervals for flooding,…

  • Ideal Grow Tent Humidity & VPD Targets for All Stages

    Home > Indoor Environment > Ideal Grow Tent Humidity & VPD Targets for All Stages Last Updated: July 11, 2026 | Fact Checked By: Current Gardening Editorial Team Quick Answer: Ideal Grow Tent Humidity The ideal grow tent humidity drops progressively as your plant ages. Seedlings require 70% to 80% humidity to establish early roots. Vegetative plants thrive at 50% to 70%. Flowering and fruiting plants must be kept strictly between 40% to 50%. Dropping the humidity during the flowering stage is absolutely critical to prevent bud rot (Botrytis) and powdery mildew. Seedling Stage 70% – 80% RH Veg Stage 50% – 70% RH Flower Stage 40% – 50% RH…

Leave a Reply

Your email address will not be published. Required fields are marked *